The Three Phases to Expect for Bitcoin Price Before and After the BTC Halving
- BitcoinCrypto
- April 8, 2024
- No Comment
- 46
As the Bitcoin (BTC) halving event approaches, some individuals in the cryptocurrency market are engaging in speculation and analysis. Rektcapital, a crypto analyst with over 440 thousand followers on X, has offered valuable insights into the typical patterns observed during Bitcoin’s halving cycles. This analysis delineates three distinct phases noted in past cycles, offering potential insights into future developments.
Phase 1: The Final Pre-Halving Retrace
The first phase, also called the final pre-halving retrace, usually takes place between 28 and 14 days before the actual halving event. During this phase, investors have a last chance to buy the coin at lower prices before the anticipated decrease in supply. In the past, the depth and length of this retrace have varied. In 2016, for example, there was a 38% decline over 3-4 days, while in 2020, it lasted 56 days (8 weeks) with a 20% pullback.
Currently, we are 10 days away from the halving, and BTC has experienced an 18% retracement in the past few weeks. Similarities can be seen between the current Bitcoin cycle in 2024 and the one in 2016, as both had their pre-halving retracements starting around 30 days before the event, with 2016 starting 28 days prior.
The main objectives of this pre-halving retrace are threefold: to offer a last opportunity to buy Bitcoin at a good price, to establish the lowest point before the re-accumulation phase, and to set the stage for the next part of the halving cycle.
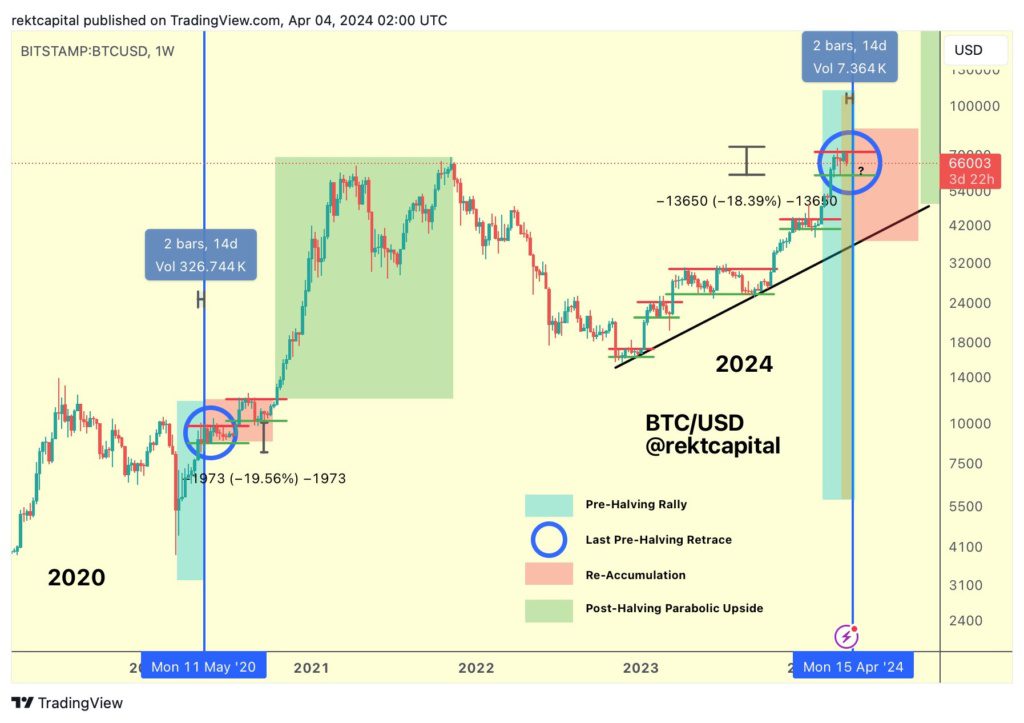
Phase 2: Re-Accumulation
The second phase, known as re-accumulation, begins once the pre-halving retrace reaches its lowest point. Historically, the bottom of the retrace has also become the bottom of the re-accumulation range. During this phase, BTC is expected to trade within a range without significant upward or downward movements, potentially lasting for several weeks or even up to 150 days (5 months).
This period can be challenging for investors because the lack of major price changes may lead to boredom, impatience, and disappointment. However, an interesting aspect of the current cycle is that this re-accumulation range is happening around the new all-time high area. As a result, this range may resemble a regular sideways trading pattern observed throughout the cycle, potentially lasting for a shorter time before the upward trend continues.
Phase 3: Parabolic Uptrend
The final and most exciting phase occurs when Bitcoin breaks out of the re-accumulation range and starts an intense upward trend known as a parabolic uptrend. During this phase, the coin experiences rapid growth in a parabolic manner. Historically, this phase has lasted a little over a year (around 385 days). However, due to the possibility of an “accelerated cycle” happening, this timeframe may be reduced by half in the current market cycle.
Rekt’s insightful analysis offers a framework for understanding the potential phases that may unfold as the Bitcoin community anticipates the halving event. The buzz surrounding the BTC halving is already evident as the coin approaches its previous all-time high, reaching up to $72,000 today, and maintaining its bullish trend that commenced on Wednesday. With the halving imminent, the question arises: will the coin follow similar patterns or not?